- Departments
- Department of Molecular Ecology
- Flow Cytometry Research Group
- Research Projects
Research Projects
In situ growth rates and mortality
Growth is a fundamental parameter in microbial ecology. Typically, growth rates are determined using dilution cultures or in uptake experiments with radiolabeled substrates. In his PhD thesis, Jan Brüwer took a cytometric approach. He deduced dividing cells by examining the DNA distribution within individual cells. Two maxima per cell are indicative of a dividing cell, just before the cell separates into two daughter cells. He successfully calibrated this approach with dilution cultures and applied it to blooming bacterial clades during two marine spring blooms in the North Sea at Helgoland. For copiotrophic clades, he determined cell division rates of up to twice per day (Brüwer et al., 2023). Surprisingly, the SAR11 clade experienced phases of extensive growth during the spring blooms similar to typical copiotrophic clades, but their cell numbers declined. Jan postulated strong mortality induced by phage infection. Using direct-geneFISH targeting the three main pelagiphage species, he showed that during a phase of high growth and cell decline, up to 19% of the SAR11 cells were phage-infected. On a global average, several percent of SAR11 were phage-infected at any given time.
During this study, Jan also discovered a cell type in which he could hybridize the infecting pelagiphage, but the 16S ribosomal RNA was not detectable. He postulated a transition state of highly infected cells running at high phage production before the final cell lysis, when cells burst to release new phage progeny. At this stage, the viruses may degrade all of their RNA to use the nucleotides as a resource for the synthesis of new phage genomes (Brüwer et al., 2024). Jan dubbed cells in this stage “zombie cells”.

Cell Sorting for Proteomics
Predicting metabolic function based on (meta-)genomic annotations alone has its limits. Expressed proteins are one step closer to the metabolism of a microorganism and its ecological role in the environment.
In this project we push the combination FISH and FACS further and combine cell sorting with metaproteomics. In pilot studies we could identify several hundreds of peptides from one million of phylogenetically stained and sorted cells. This project is part of the DFG research unit FOR 2406 (Proteogenomics Of Marine Polysaccharide Utilization - POMPU).
Find >>here<< more information on the subproject 2: In situ mechanisms of polysaccharide degradation of key bacteroidetal genera in spring algae blooms.
Grace Ho is currently doing her PhD on this project.
PhD Student
MPI for Marine Microbiology
Celsiusstr. 1
D-28359 Bremen
Germany
|
Room: |
1339 |
|
Phone: |

Visualizing cellular traits in complex planktonic samples
In recent years, the geneFISH protocol has been further optimized in our department to detect specific genes in complex natural samples (Barrero-Canosa et al., 2017). During her PhD, Laura Zeugner succeeded in further simplifying the protocol without losing its specificity. Within 4 hours, she was able to detect genes encoding for two different glycoside hydrolase family 92 enzymes (GH92) in complex planktonic samples using high-resolution microscopy. Both GH92 degrade mannose-containing polysaccharides and are encoded together with other carbohydrate-active enzymes in so-called polysaccharide utilization loci (PULs). Laura was able to detect the GH92 of a conserved PUL in unicellular Polaribacter and Formosa in marine plankton samples. Interestingly, Laura detected not only free-living but also GH92-positive cells attached to marine particles, broadening our ecological view of flavobacterial mannose degradation (Zeugner et al., 2021).

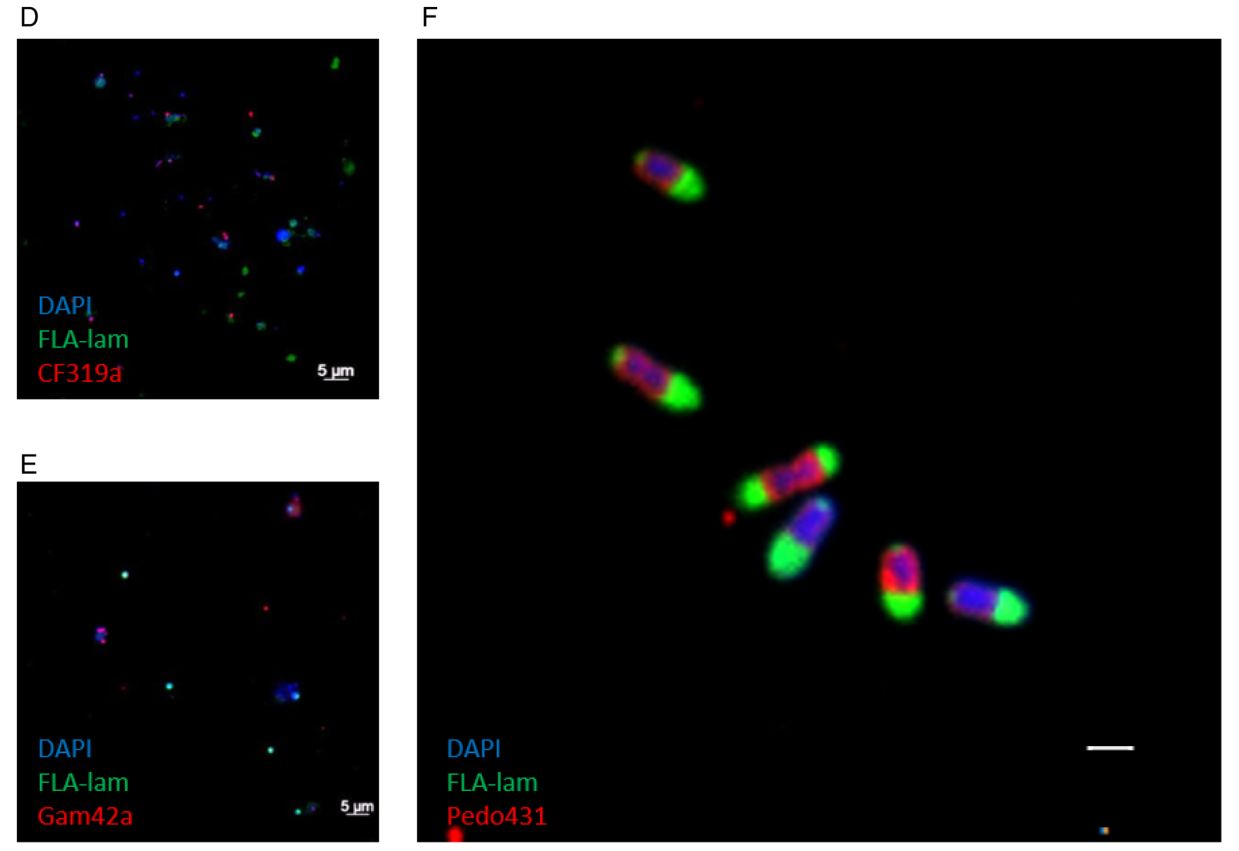
In her PhD thesis, Greta Giljan took a different approach. She used fluorescently labelled polysaccharides such as laminarin and fucoidan to test which microorganisms take up these substrates via the selfish mechanism. In short-term incubations with North Sea water from Helgoland, cells that took up large amounts of polysaccharides into their periplasm were sorted by flow cytometry and identified taxonomically. Overall, we found strong seasonal variations in polysaccharide uptake. In particular, the strongest fluorescence signals came from cells belonging to the verrucomicrobial family Pedosphaeraceae (Giljan et al., 2022)

Niche partitioning of the wide-spread flavobacterial clade NS5
Since its discovery in the early 2000, NS5 is a flavobacterial clade that has been frequently found in bacterioplankton analyses, but has not been further characterized in any studies. During his PhD, Taylor Priest studied the NS5 clade on a global scale and was able to delineate six genera including four novel NS5 genera comprising 35 species-level clusters. Using samples from the FRAM Strait (Priest et al., 2021), he compiled a metagenomic dataset and reconstructed the metabolism of assembled NS5 MAGs. Through careful bioinformatic analyses, Taylor was able to constrain distinct ecological niches for them on a global scale (Priest et al., 2022). For example, NS5_D is adapted to higher temperatures, whereas NS5_F is restricted to cold polar waters. While the former had a higher polysaccharide degradation potential, the latter had the highest number of TonB-dependent transporter systems. In summary, Taylor convincingly shows that the niche partitioning of NS5 depends on both, biotic and abiotic factors, and he has been able to identify such sets of niche determining factors for each NS5 genus.

Southern Pacific Gyre
The Southern Pacific Ocean (SPG) is the most remote oceanic region on earth, characterized by clearest waters and extreme nutrient limitation. Due to its extreme oligotrophy it is often referred to as an ‘oceanic desert’.
In a joint research cruise with the Department of Biogeochemistry we sailed across the SPG to explore the microbial community and its capabilities to cope with such extreme conditions. The cruise took place in December 2015 to January 2016 in a track across the oligotrophic gyre from Chile to New Zealand. After a first screening with an on-board sequencing pipeline and on-board FISH analyses (Reintjes et al., 2019) we focussed on characterizing novel clades by targeted flow cytometry and metagenomics. Nine metagenomes from three stations from the oligotrophic gyre centre from three surface layers have been constructed and analyzed in depth by Monika Oggerin.
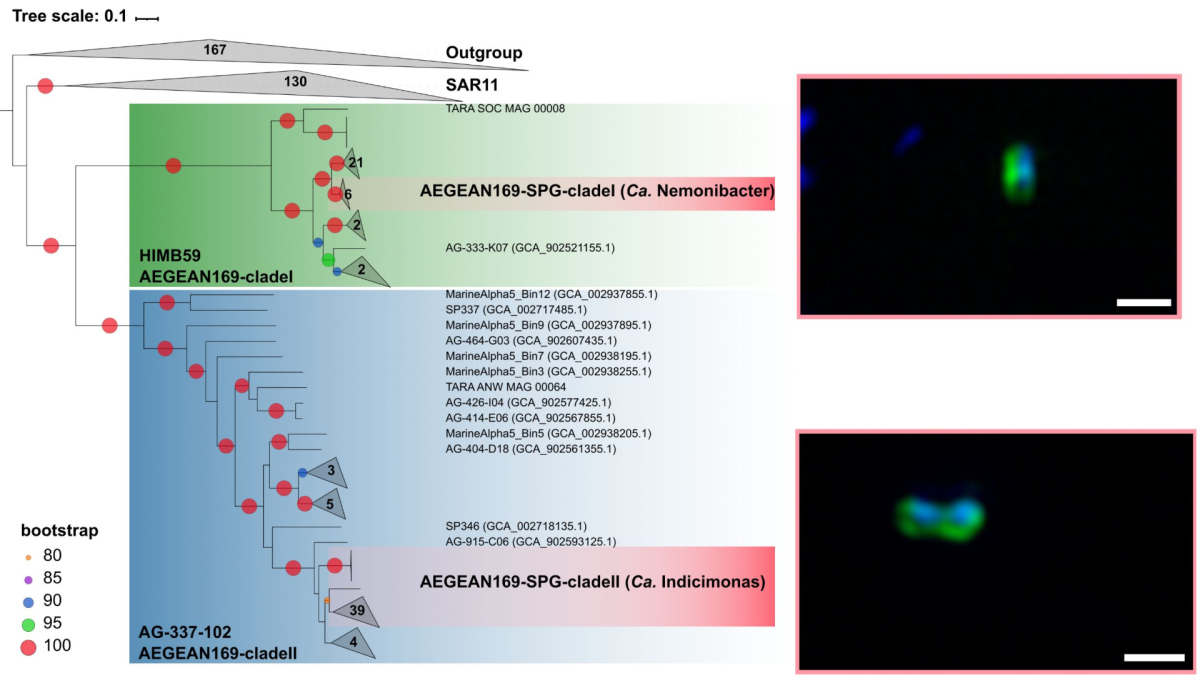
One of the dominant groups, the marine alphaproteobacterial group AEGEAN169, was detected by fluorescence in situ hybridization at relative abundances of up to 6% of the total microbial community in the uppermost water layer. Two distinct clades within AEGEAN169, Candidatus Nemonibacter and Ca. Indicimonas (Oggerin et al., 2024) have been identified. Comparative metagenomic and metatranscriptomic analyses of the two AEGEAN169 clades showed that they encode subtle but distinct metabolic adaptations to the extreme SPG compared to their competitors SAR11, SAR86, SAR116, and Prochlorococcus. Both AEGEAN169 clades had the highest percentage of transporters per predicted protein (9.5 and 10.6%, respectively) reported to date for bacteria. In particular, ABC transporters were highly expressed, which in combination with proteorhodopsins suggests a scavenging lifestyle for both AEGEAN169 clades. In summary, both clades are uniquely adapted to the scarce resources in the uppermost layers of the surface waters of the SPG and are highly competitive (Oggerin et al., 2024, in review).


