Seitenpfad:
Weblog9

Chief scientist leg4
Frank Wenzhoefer
f.wenzhoefer.d at merian.briese-research.de
Frank Wenzhoefer
f.wenzhoefer.d at merian.briese-research.de
Weblog 9
23.11. - 25.12.
Mission possible
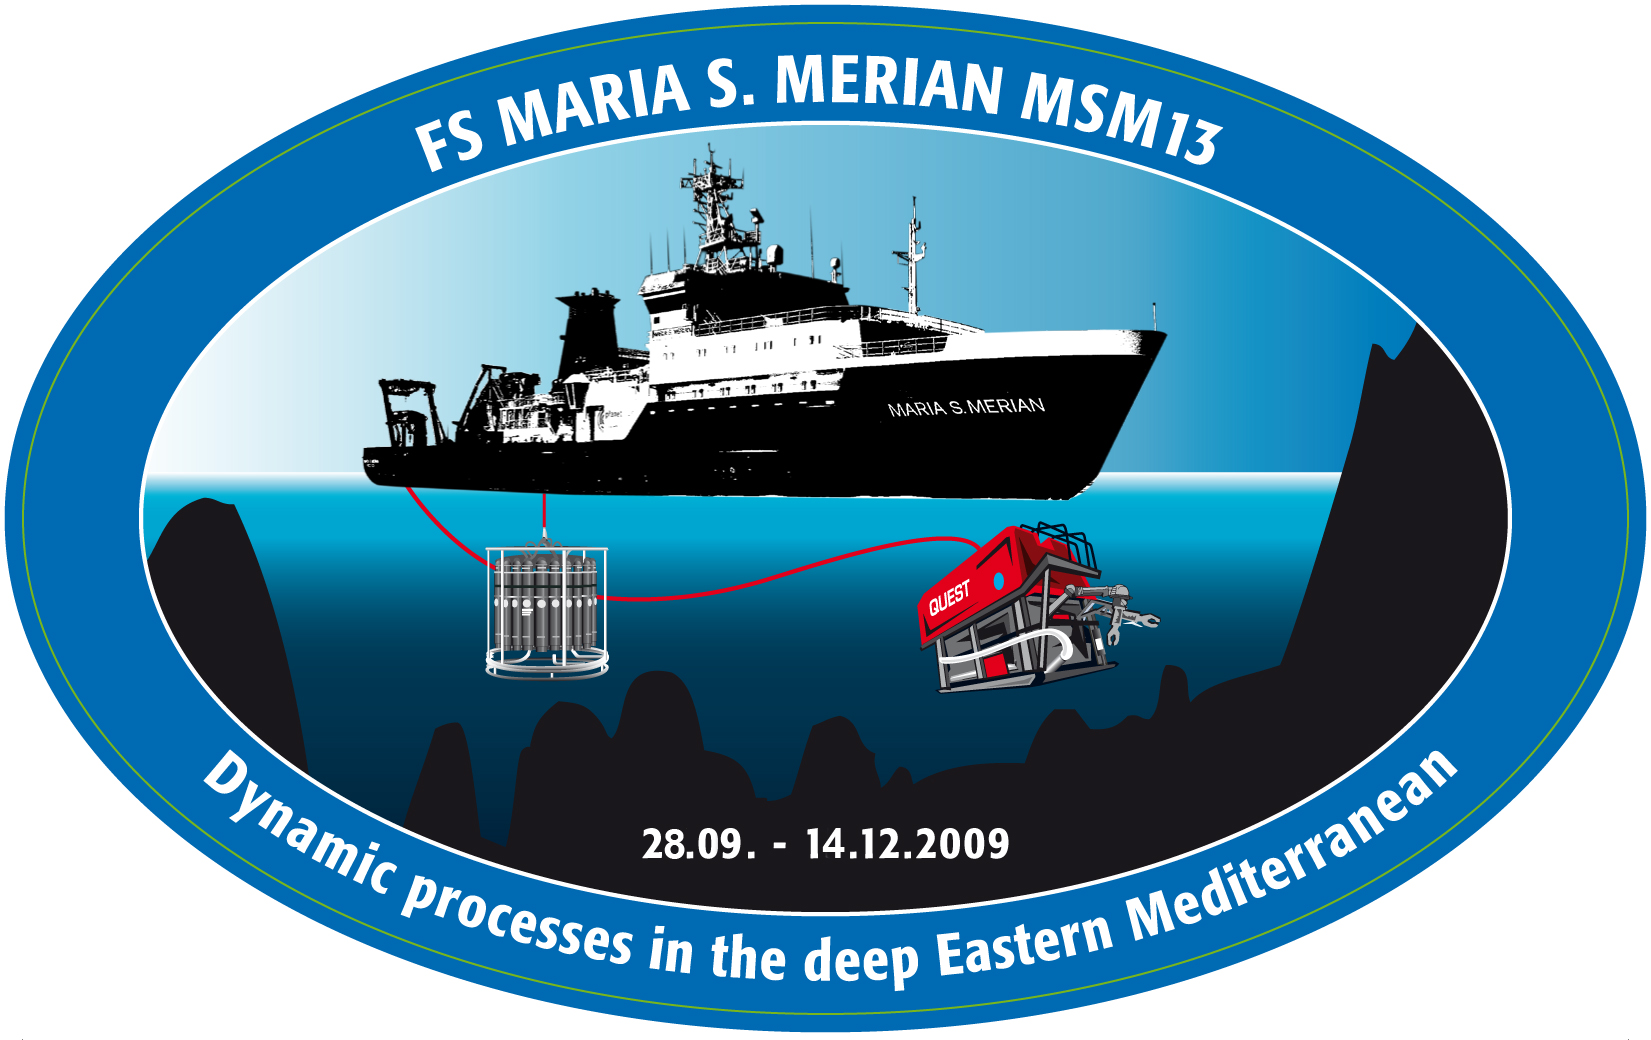
The last days were in focus of the first AUV missions. On November 23 Gerrit Meinecke and his AUV-team started their first mission to map the Amsterdam MV. Everyone on board was curious how the AUV would work and if it would reach its working depth of 1980 m. The weather and sea conditions where ideal; sunny and calm sea. After the AUV was launched, first communication tests however revealed some problems. The acoustic communication failed. The AUV-team immediately worked on the problem but it took some hours to find out that the underwater positioning system created some interference with the underwater communication system, which caused the break down of communication between the AUV control container and the AUV. But the problem could be solved and the AUV finally started it descend to the seafloor. Faster than expected it arrived at the bottom and started its survey. After 2 hours of seafloor mapping the AUV was safely recovered and Gerrit, Jens, Eberhard and Paul were quite happy after the first real deep-sea dive. The processed high-resolution bathymetry map gave as a first impression of the roughness of the northern part of the mud volcano and we were looking forward to map larger areas.
23.11. - 25.12.
Mission possible
The last days were in focus of the first AUV missions. On November 23 Gerrit Meinecke and his AUV-team started their first mission to map the Amsterdam MV. Everyone on board was curious how the AUV would work and if it would reach its working depth of 1980 m. The weather and sea conditions where ideal; sunny and calm sea. After the AUV was launched, first communication tests however revealed some problems. The acoustic communication failed. The AUV-team immediately worked on the problem but it took some hours to find out that the underwater positioning system created some interference with the underwater communication system, which caused the break down of communication between the AUV control container and the AUV. But the problem could be solved and the AUV finally started it descend to the seafloor. Faster than expected it arrived at the bottom and started its survey. After 2 hours of seafloor mapping the AUV was safely recovered and Gerrit, Jens, Eberhard and Paul were quite happy after the first real deep-sea dive. The processed high-resolution bathymetry map gave as a first impression of the roughness of the northern part of the mud volcano and we were looking forward to map larger areas.
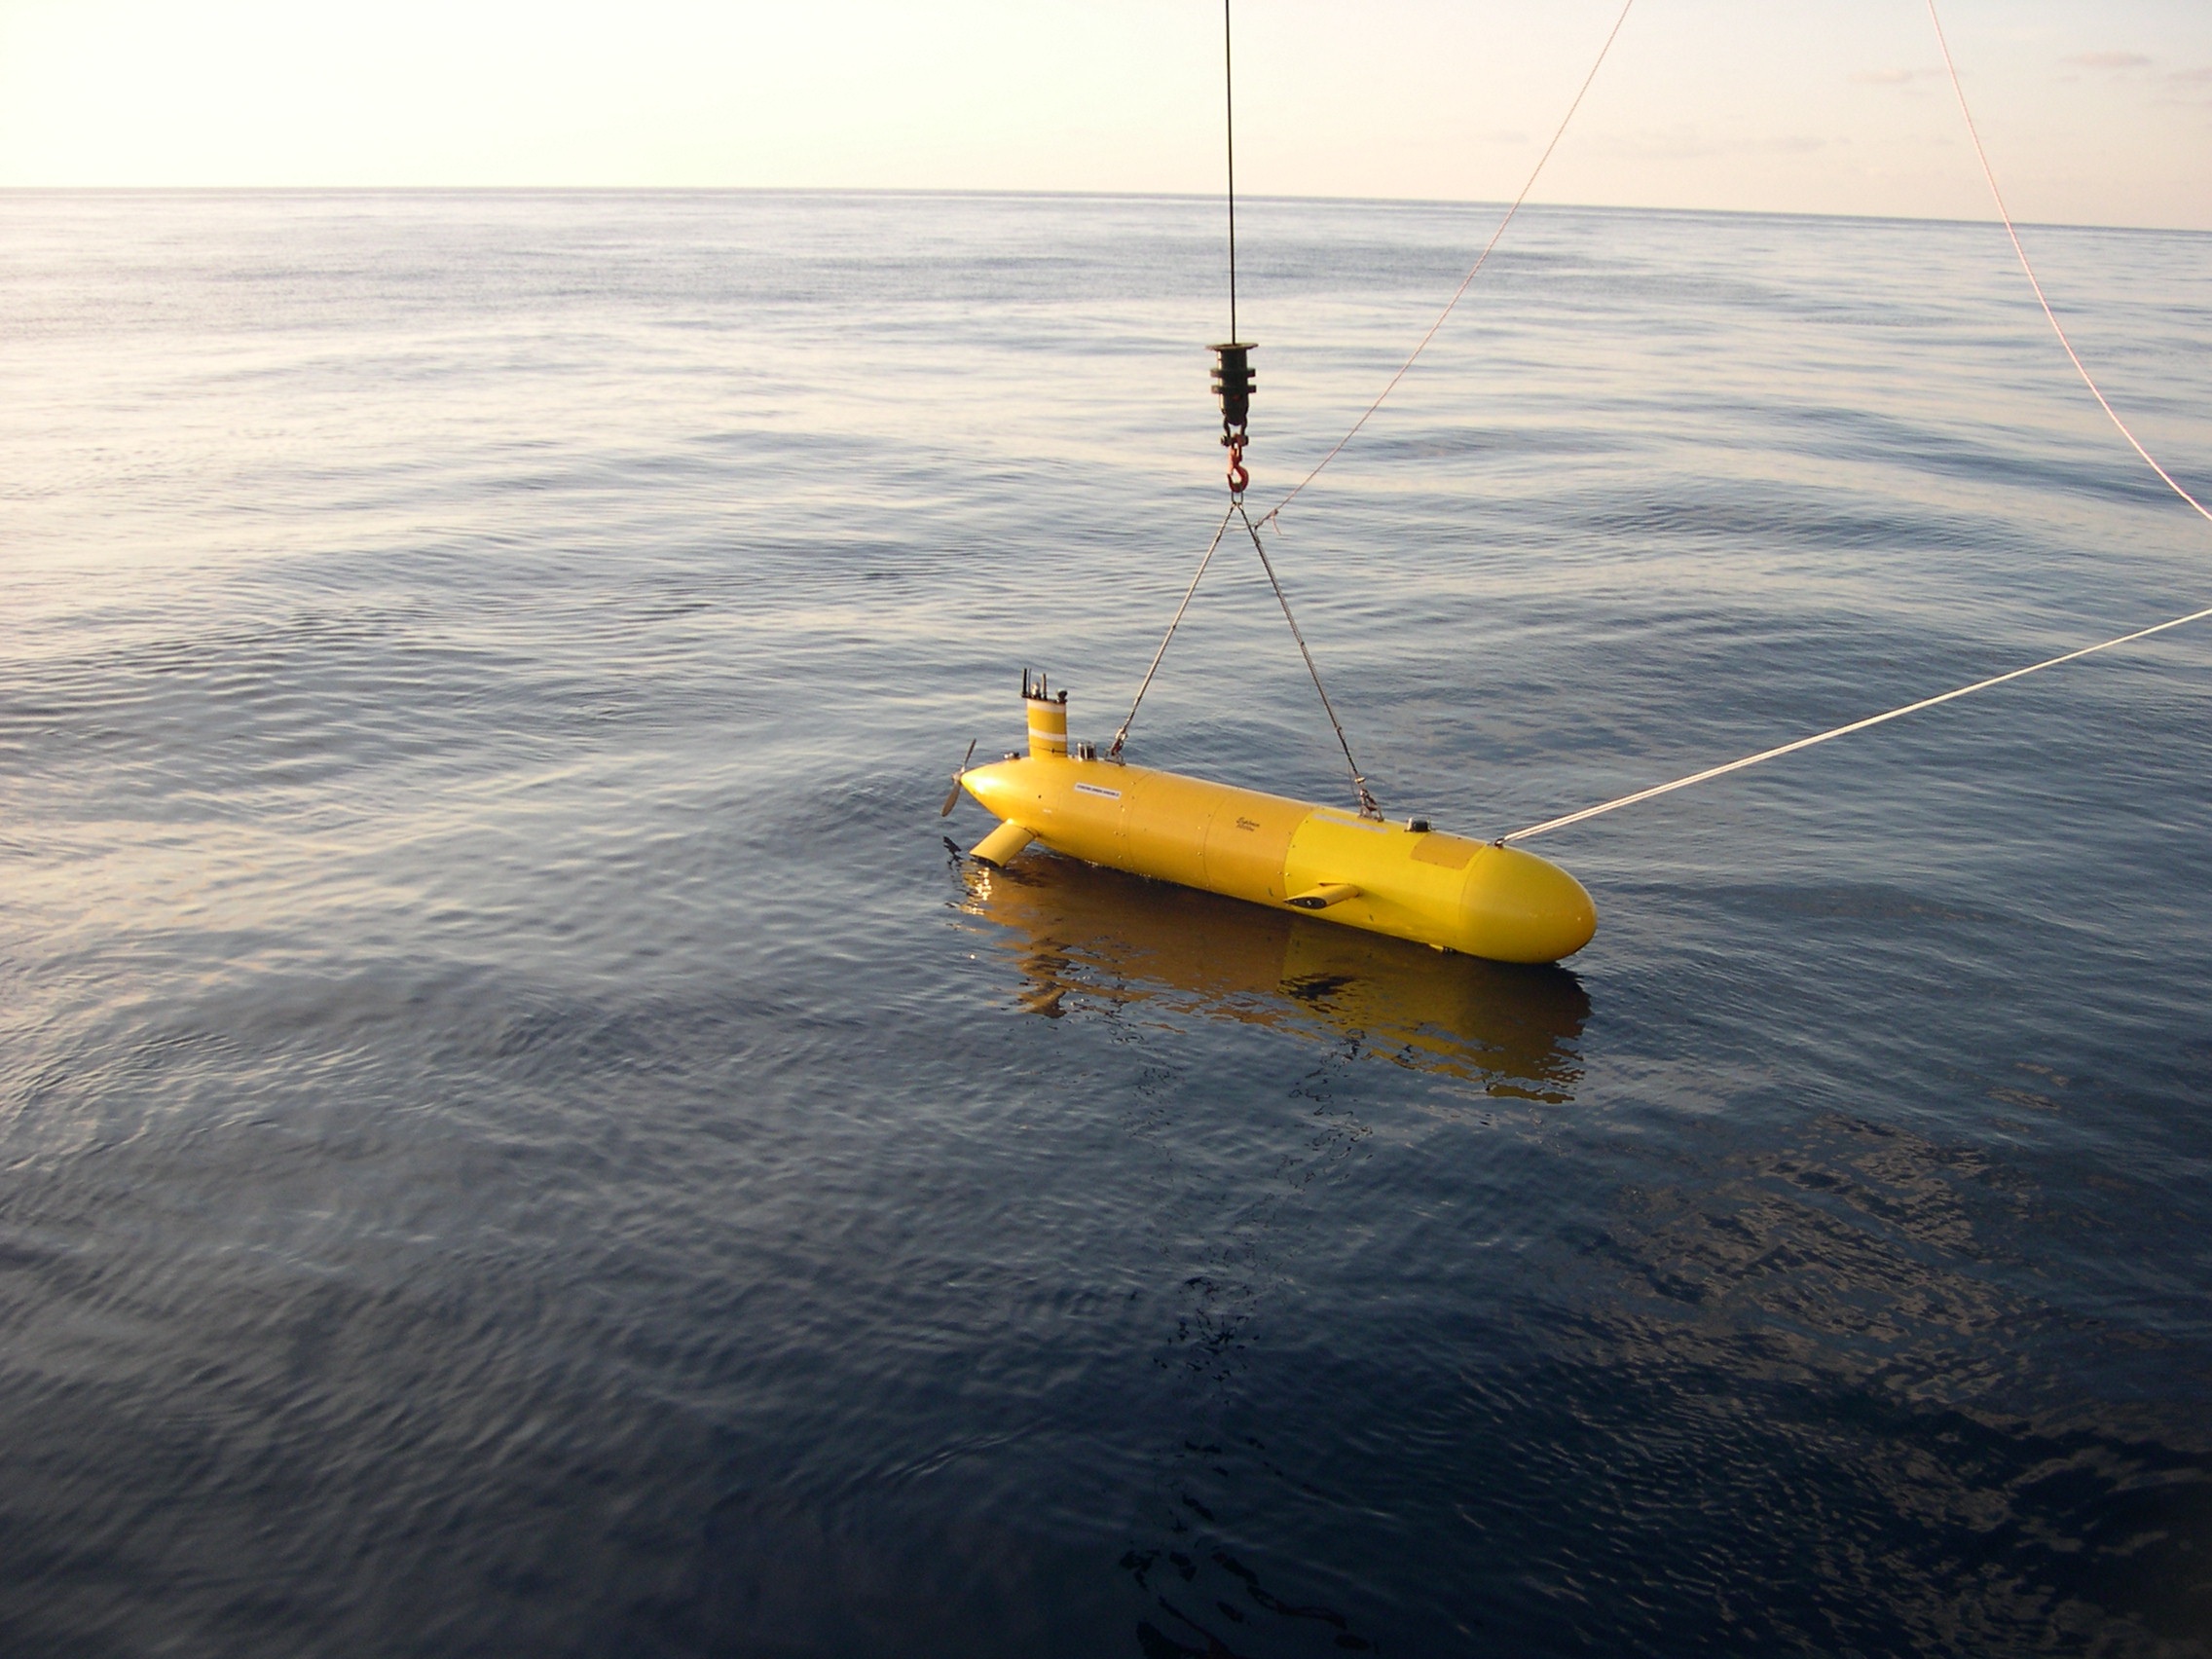
Fig. 1 AUV B-Seal (Marum, Bremen) launched for its first deep-sea mission (Source: F. Wenzhöfer)
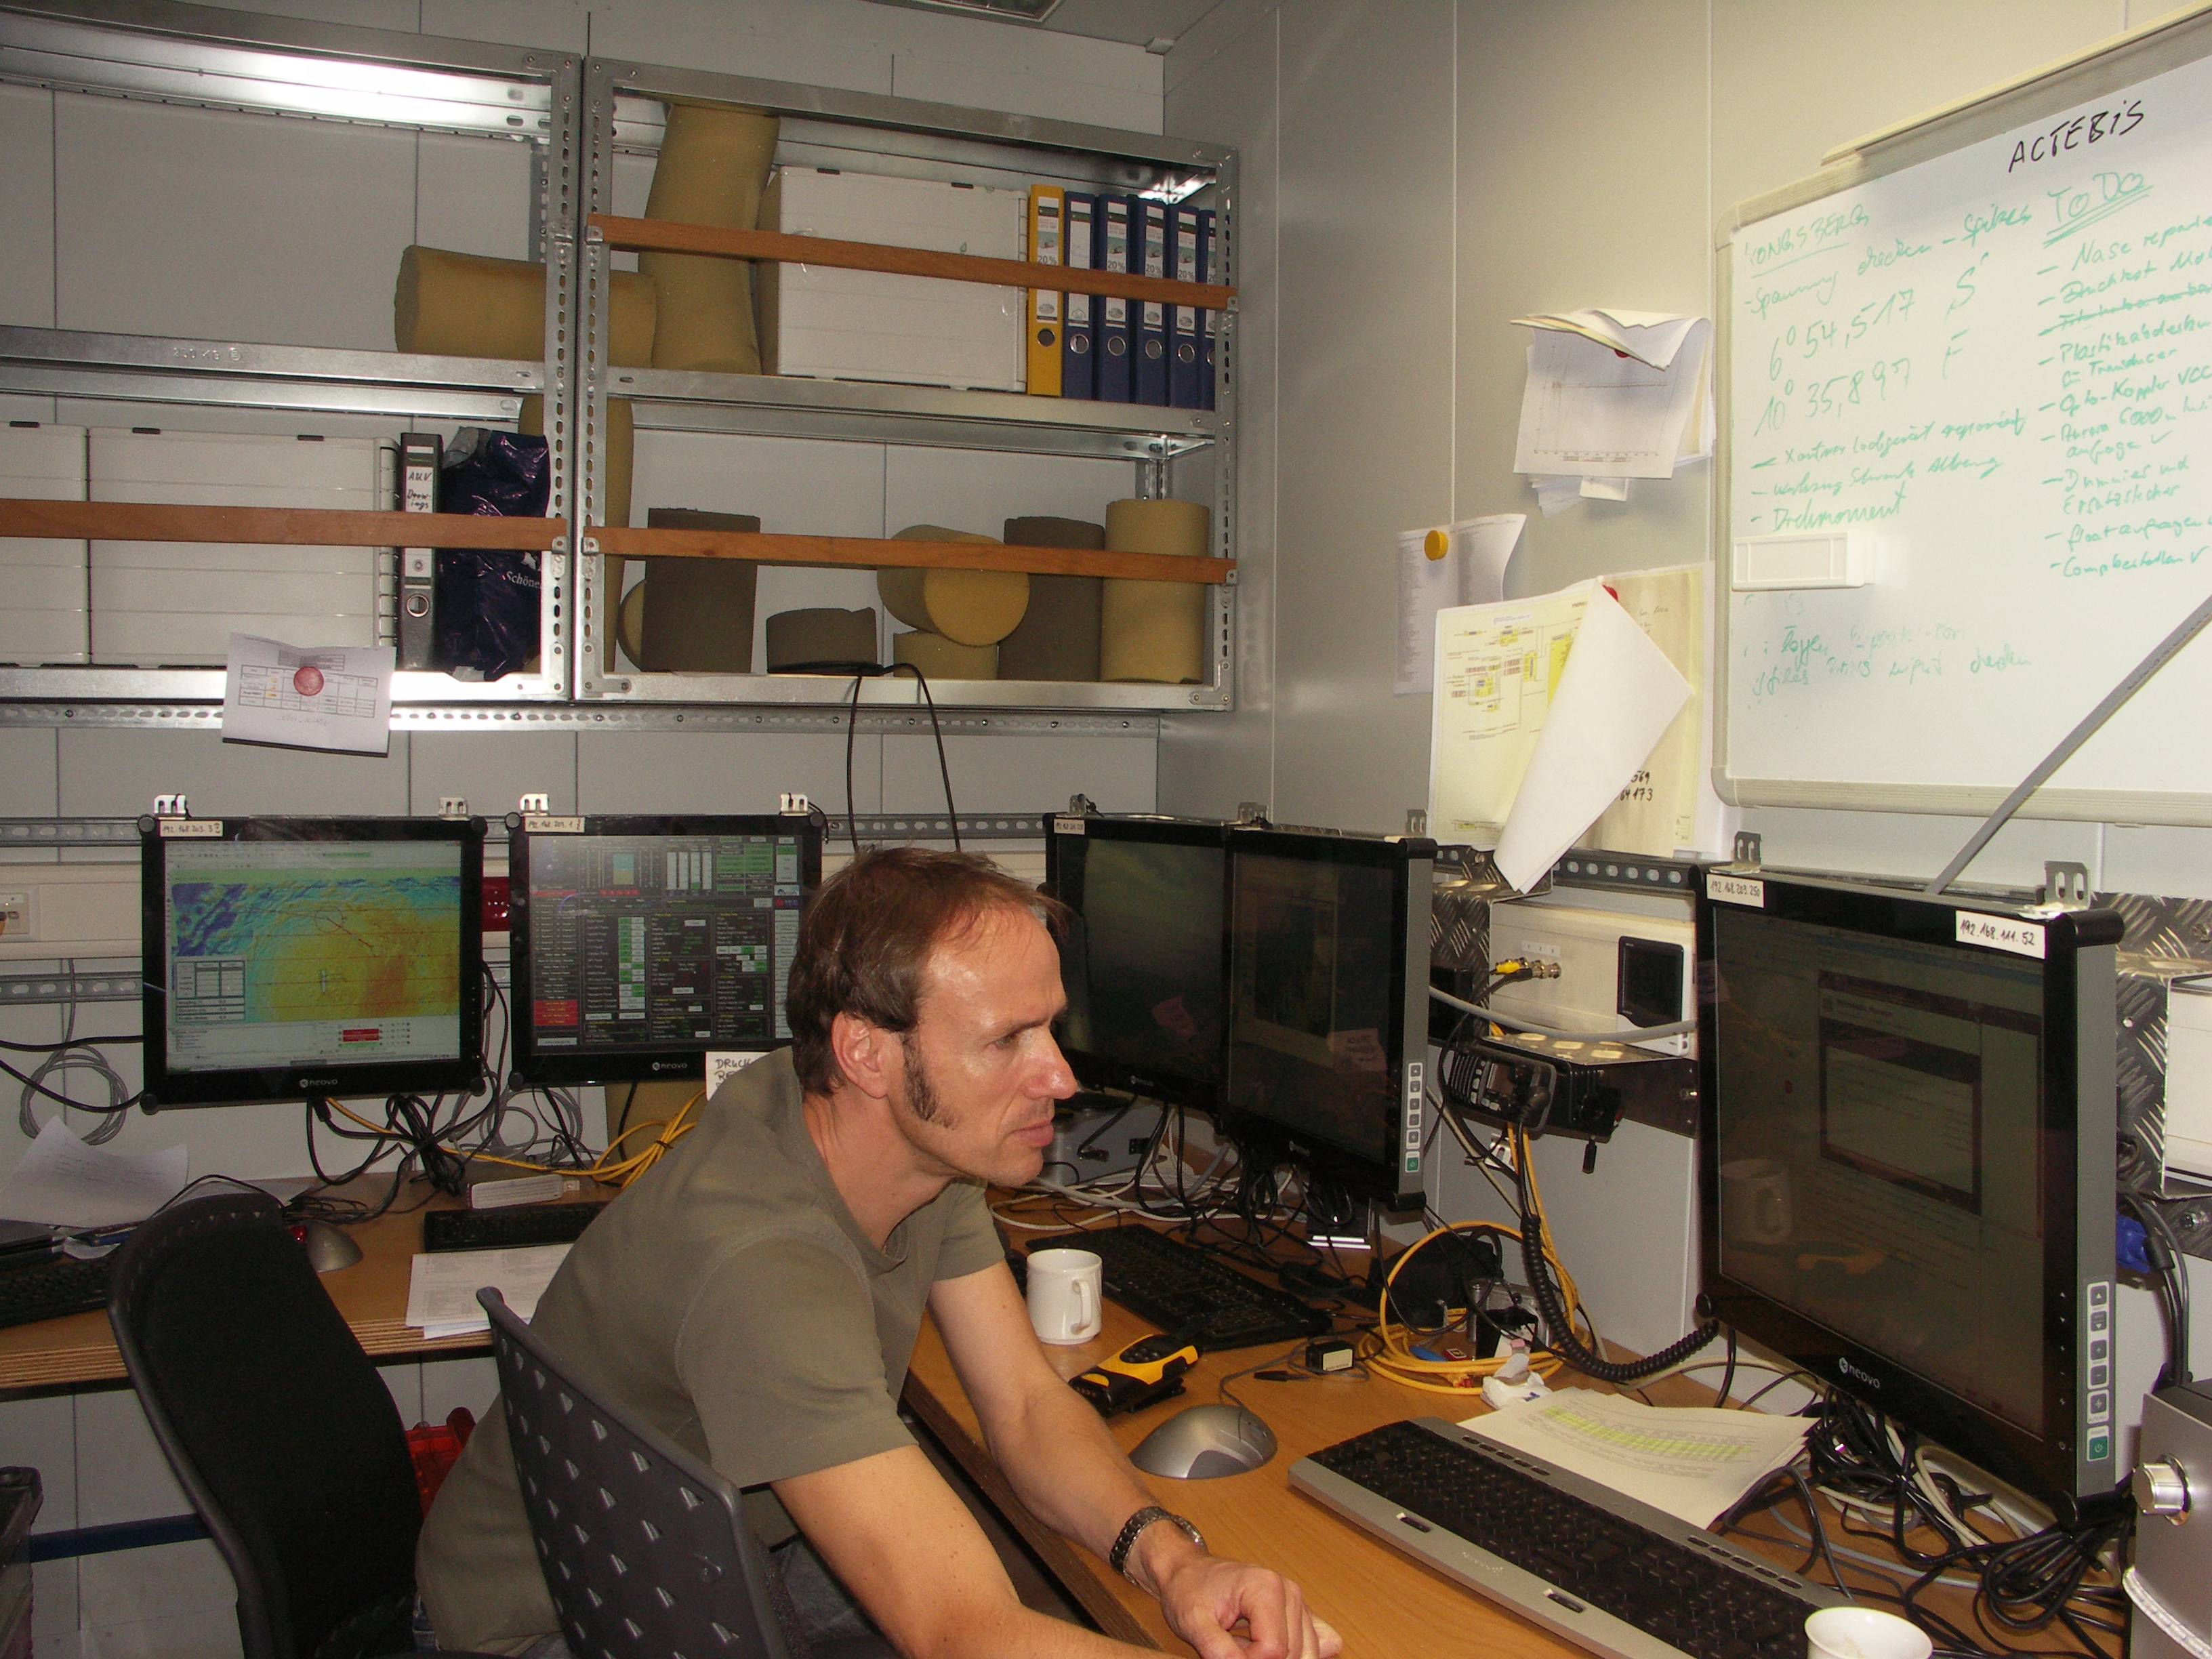
Fig. 2 Jens Renken controlling the AUV mission from the AUV control container (Source: P. Wintersteller)
Fig. 3 Preliminary 3-D high-resolution bathymetry map of the northern area of the Amsterdam mud volcano (Source: Marum, Bremen)
During AUV- dive 23 on November 25 the AUV-team was then able to perform a complete dive without any failure. All mission steps were performed as planed and the dive even revealed that descend and ascend speed of the AUV was faster than thought. The mission covered now the entire center area of the mud volcano and when all multibeam data are processed we hope to get better insights in the small-scale structure of the mud volcano. Such high-resolution bathymetry maps are essential to relate our ROV video observations and measurements to the mud volcano structure. The processed maps will also be used to plan our upcoming ROV dives.
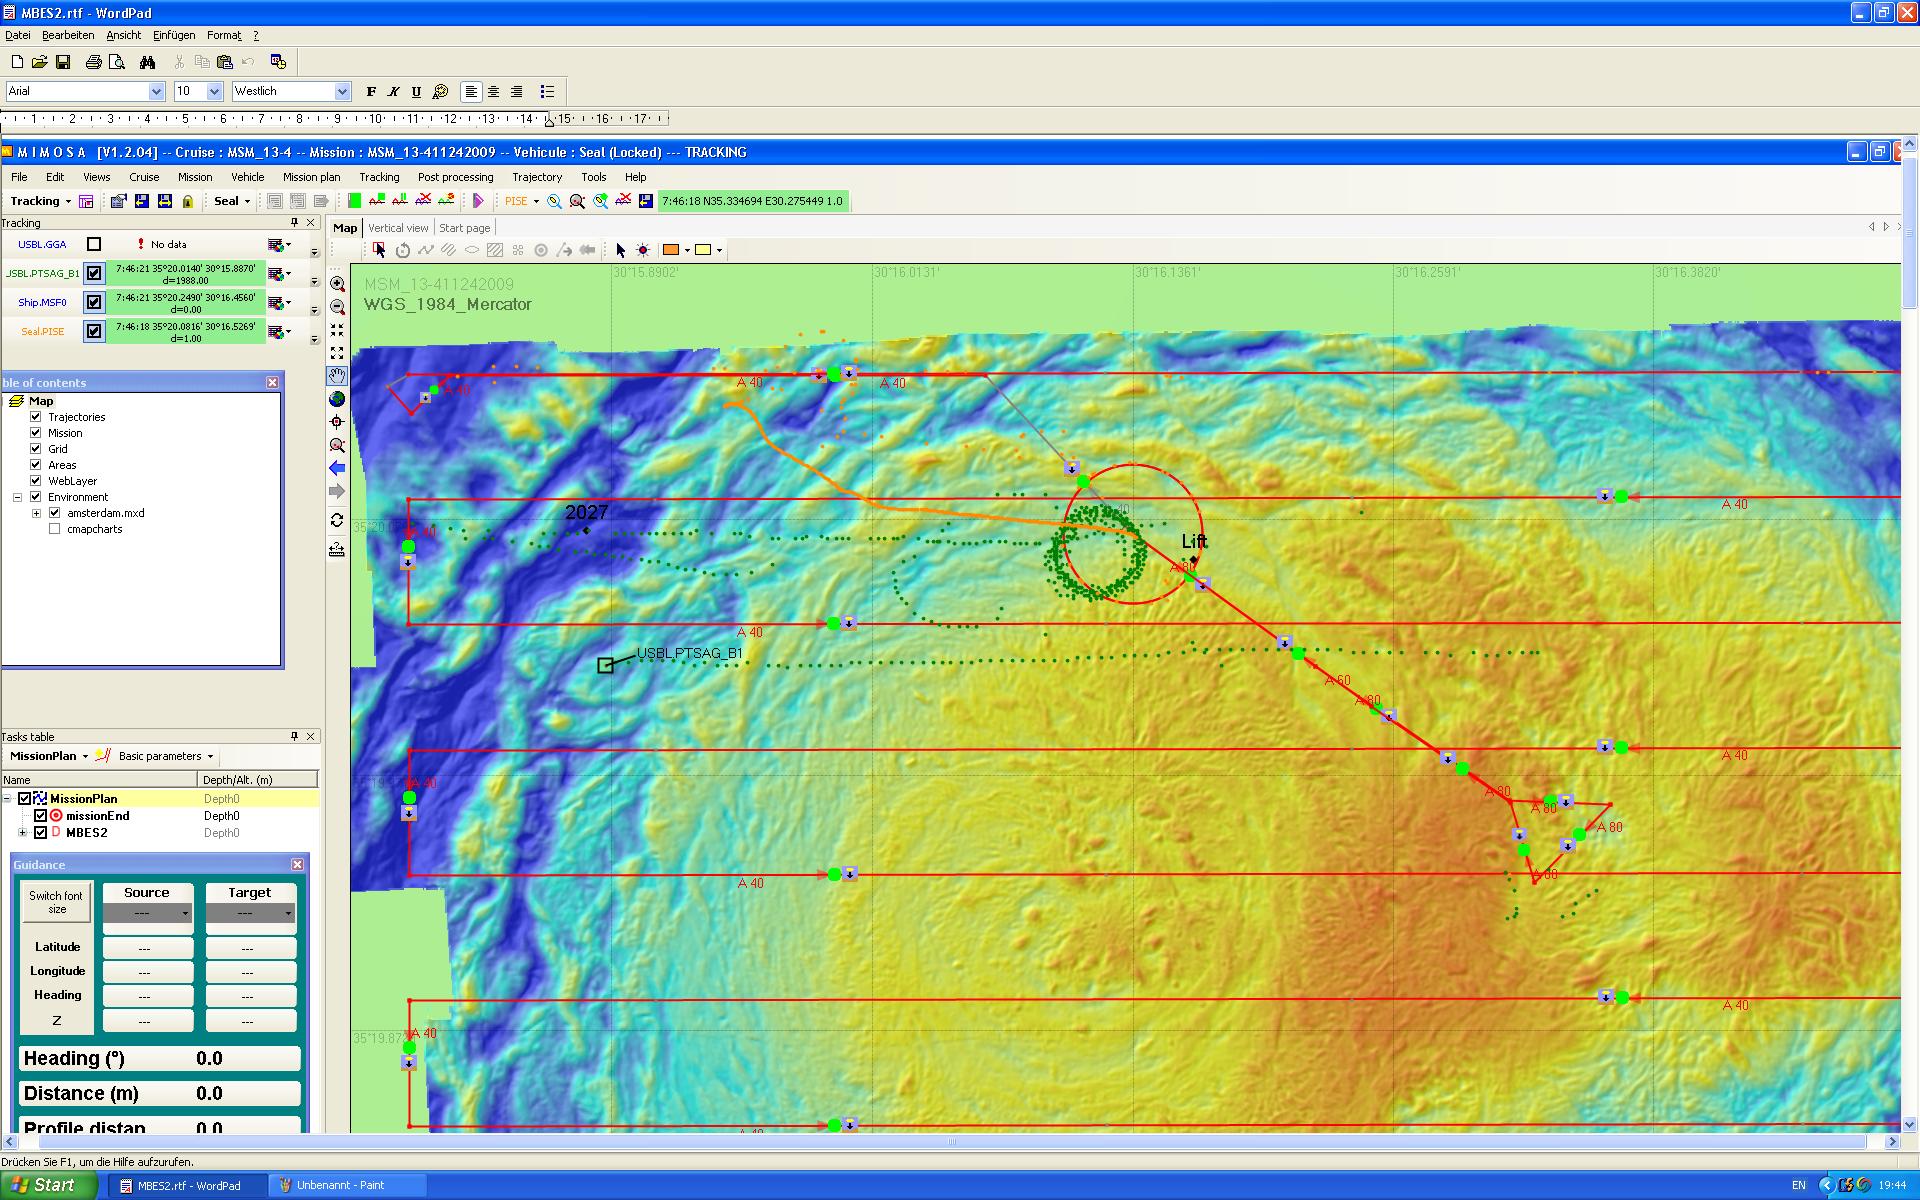
Fig. 4 AUV mission plan showing the given transects the AUV should fly along (Source: Background seafloor map Medeco cruise Ifremer, Brest; Survey grid Marum, Bremen)
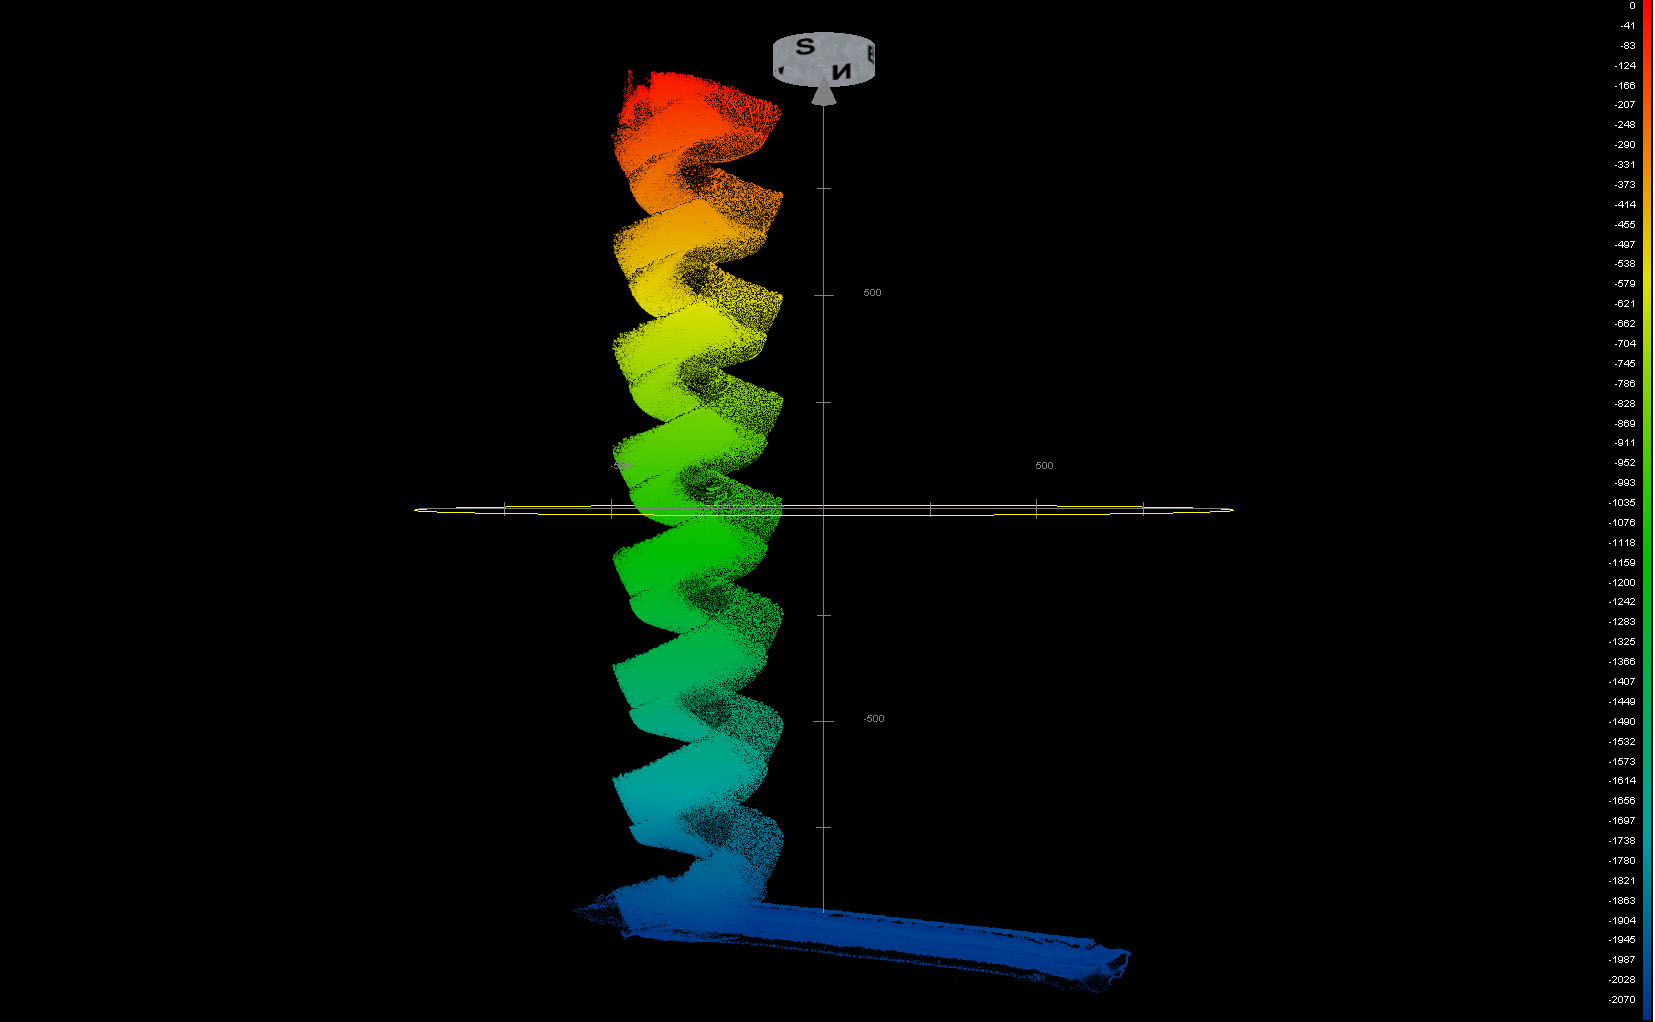
Fig. 5 AUV screwing up from 1980m (Source: Marum, Bremen)
In between the AUV and ROV dives Gero Wetzel measured the temperature gradient within the sediment using the IFM-Geomar (Kiel) heat-flow lance. Gero spent several hours crossing the center with his long thermometer. After finishing 23 heat flow measurements, conduced during two 8-hour measuring campaigns, he was able to locate the hot spot of the mud volcano. It is located in the middle of the cone shaped center of one the three elevations. Measurement 990-10 showed the highest temperature while measurement 990-9 revealed an irregular temperature profile. A first preliminary interpretation from our college Tom Feseker (Ifm-Geomar) sitting back home in Kiel indicated that the Amsterdam MV shows temperature anomalies over a large area. These data help us now to plan the next dives and geological sampling, since we are interested how the seafloor and habitats looks like at these spot.
Fig. 6 Heat flow transect across the Amsterdam mud volcano (Source: Background seafloor map Medeco cruise Ifremer, Brest; Temperature transect Ifm-Geomar, Kiel)
The other in between program was to search and indentify gas flares using Parasound. Miriam Römer, together with our Turkish observer Burak, spent an entire night to map the mud volcano. They found several flares, which will be the focus of our next dive.
Frank Wenzhöfer
Frank Wenzhöfer